

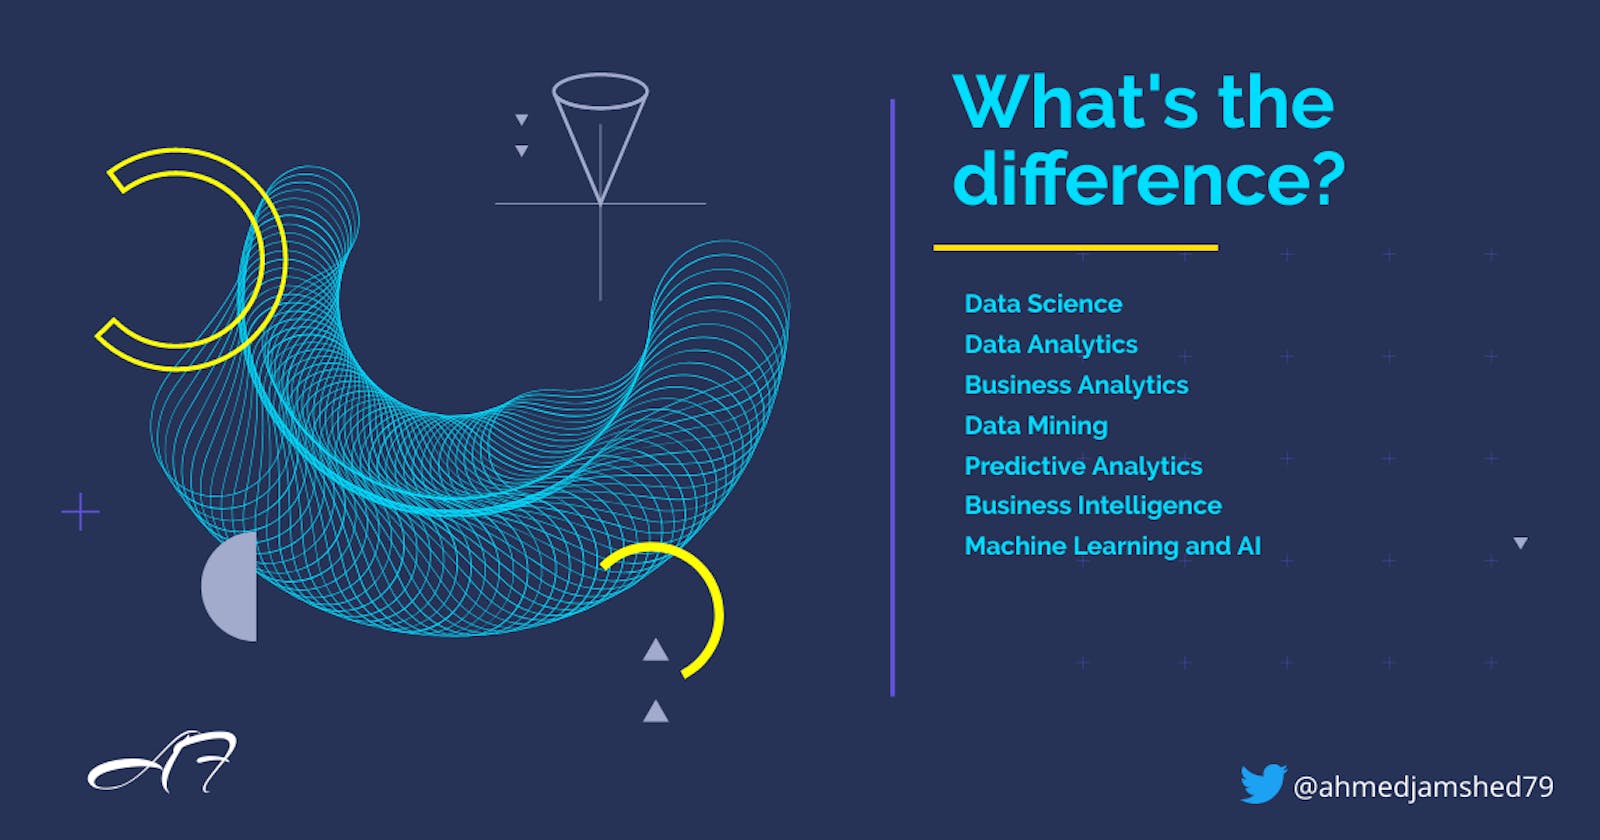
Data Science Buzzwords Explained
Data Science, Data Analytics, Business Analytics, Data Mining, Predictive Analytics


Introduction
In October 2012, Harvard Business Review declared data science “the sexiest job of the 21st century”, which is arguably still true to this day. Since then, the demand for data scientists is surging. With the increase in demand, more and more people started pursuing data science as a career, and universities around the world started offering degrees in data science not just at the master's level, but also at the undergraduate level.
However, in a recent couple of years, many data science buzzwords have also appeared in the market which confuses many young students who are planning to pursue a career in it. When searching for what data science is and what careers they can work in, these buzz words (Data scientist, Business Intelligence Analyst, Business Analytics, Data Analytics, Predictive Analytics, Data mining, Advance analytics, etc) sometimes overwhelms them.
Before we explore these buzz words in detail, let me shed some light on how they became so complicated. Analyzing data is not something new. A statistician, 25 years ago, was kind of doing the same thing (Gathering data and applying statistical methods to that data to gain some insights). However, with the growth of data and improvements in technology, a statistician was also required to find patterns in the data, hence a new word came up, Data Mining. In 2001, William S. Cleveland, an American computer scientist, took data mining to another level by combining it with computer science. He developed new advanced mathematical models which enabled statisticians to perform more accurate forecasts and a new term came to the market, Predictive Analytics.
In 2008, Dr. DJ Patil and Jeff Hammerbacher, heads of analytics and data at LinkedIn and Facebook respectively, coined the term ‘data science’ to describe this emerging field of study. Data Science is now the umbrella term used for a discipline that spans Programming, Statistics, Data Mining, Machine Learning, Analytics, Business Intelligence, Business Analytics, Data Visualisation, and a host of other subject areas. Data science is constantly changing and evolving, as it moves to keep abreast of technology and business practices alike.
This article aims to introduce all these complicated terms and how they intertwine with each other in a broader perspective.
Analysis vs Analytics
Let us first understand the difference between the words Analysis vs Analytics. These words might seem similar, but there is a slight distinction between them.
Analysis deals with the past. It is about the study of past data and analyzing how and why things happened the way they happened. For example, analyzing the data of past sales and finding out how sales decreased last summer.
Analytics on the other hand, deals with the future. It is about finding patterns in the data and exploring potential future outcomes based on those patterns. For example, finding patterns in the sales data and user experience data to find out which month to introduce the new product for maximum sales.
There are two different branches of analytics:
Qualitative analytics: It is about using your intuition and experience in conjunction with analysis to plan your next business move
Quantitative analytics: it is about applying formulas and algorithms to data you have gathered
Note: Nowadays, the term analytics is used to represent both analysis and analytics. Therefore, to avoid any complications, we will simply use the word analytics further in this article.
Business Analytics, Data Science, and Data Analytics
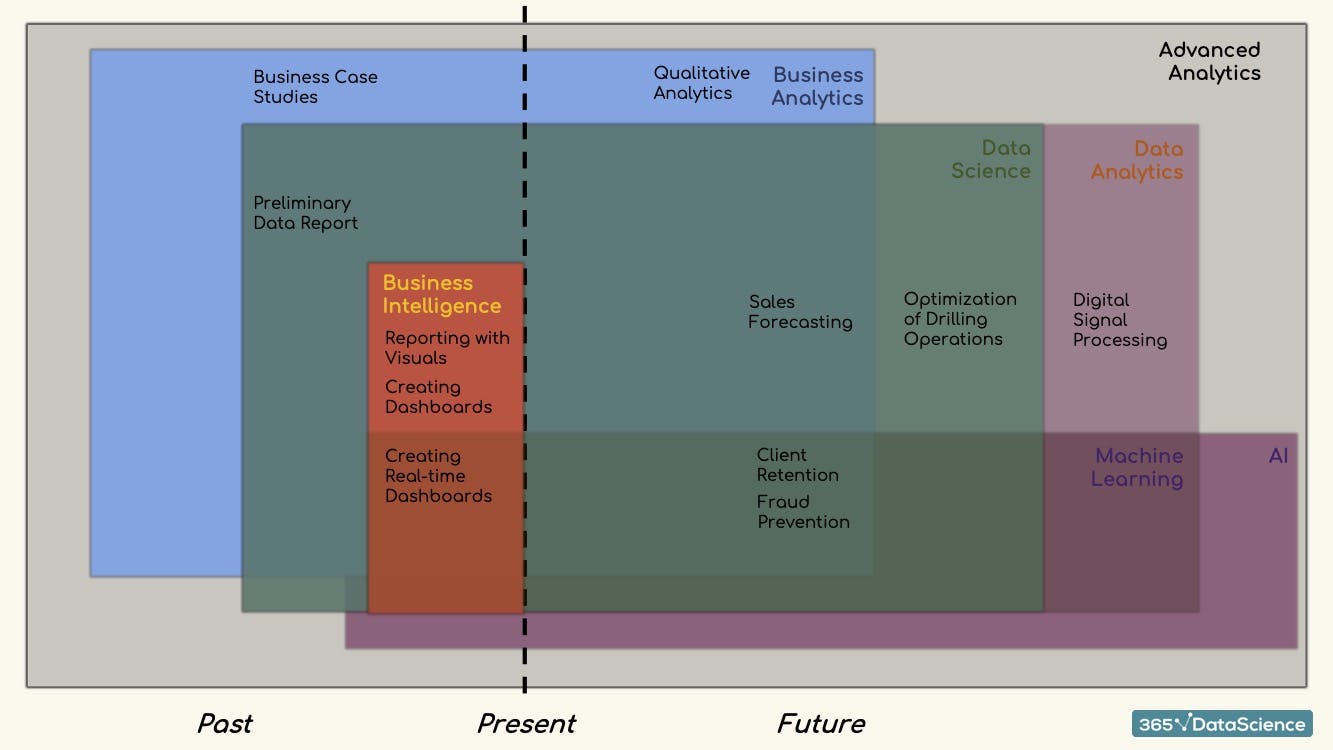
Now that we have learned the difference between the terms analysis and analytics, and we have also learned that when the term analytics is used, it includes both analysis and analytics, let’s take a look at the diagram below:
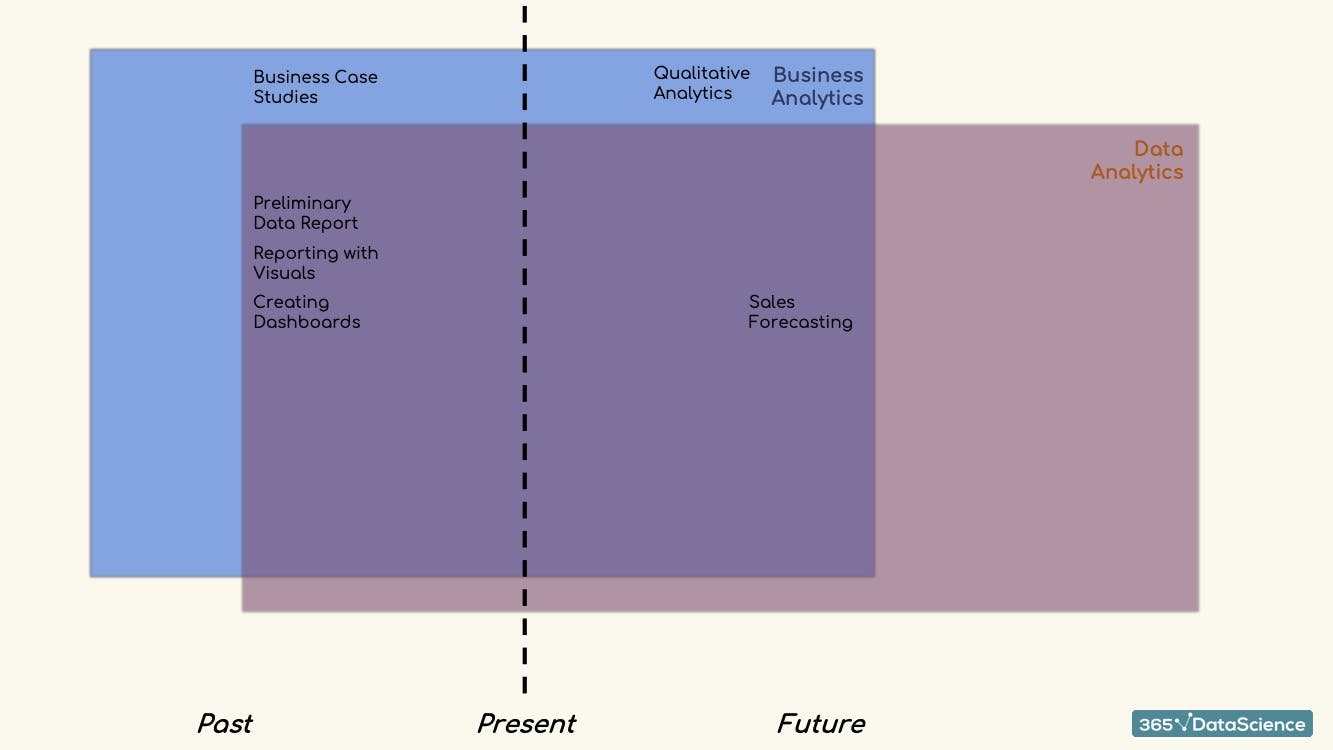
The diagram is divided by a dotted line. Everything on the left of the line refers to activities that aim to explain past behaviors and everything on the right refers to activities that aim to predict future behavior. Here you can see that analyzing business case studies or performing qualitative analytics does not need digital data, hence they are separated from the data analytics block. But they are still a part of business analytics. These activities are usually performed by business analysts.
On the other hand, activities that involve the analytics of digital data to create a positive impact for business are all inside the data analytics block where it overlaps with the business analytics block. Activities like creating data reports, and dashboards, reporting insights with visuals, and forecasting sales can all sit within this block.
Now lets us fit Data Science into this diagram.
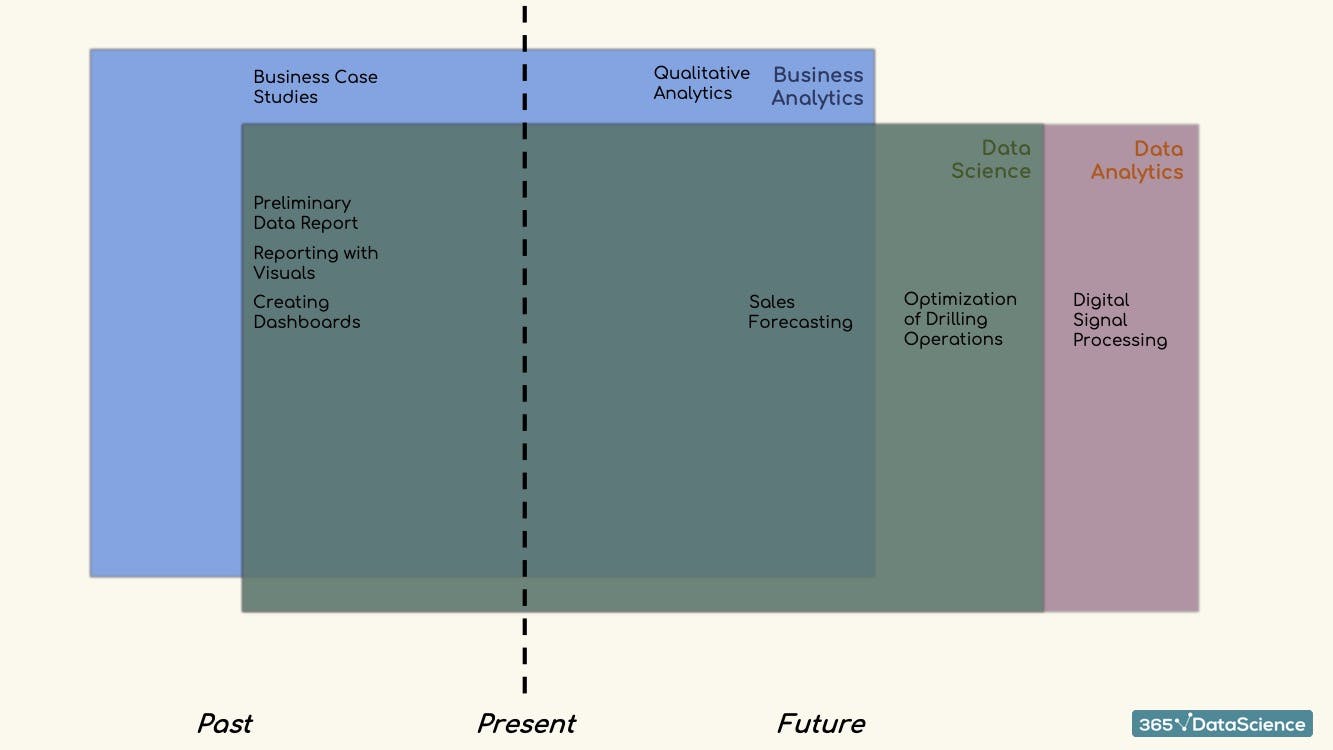
Data science is a discipline relying on data. But business analytics, as discussed above, does not completely rely on data. Data science also incorporates part of data analytics that mostly includes complex mathematical, statistical, and programming tools.
Since the green data science block overlaps with the business analytics block, we can say that creating preliminary data reports, reporting data with visuals, creating dashboards, and forecasting sales are all of interest for a data scientist who is working for a corporation.
However, as you can see that data science block goes beyond the business analytics block. Instead of focusing solely on business-related issues, data scientists can use their skills in a broader range of industries. For example optimization of drilling operations for the oil and gas industry. Similarly, not everything about data analytics interests a data scientist, e.g digital signal processing.
Business Intelligence
I’m sure that so far you have understood what business analytics, data science, and data analytics are. Now let’s add Business Intelligence to the diagram.
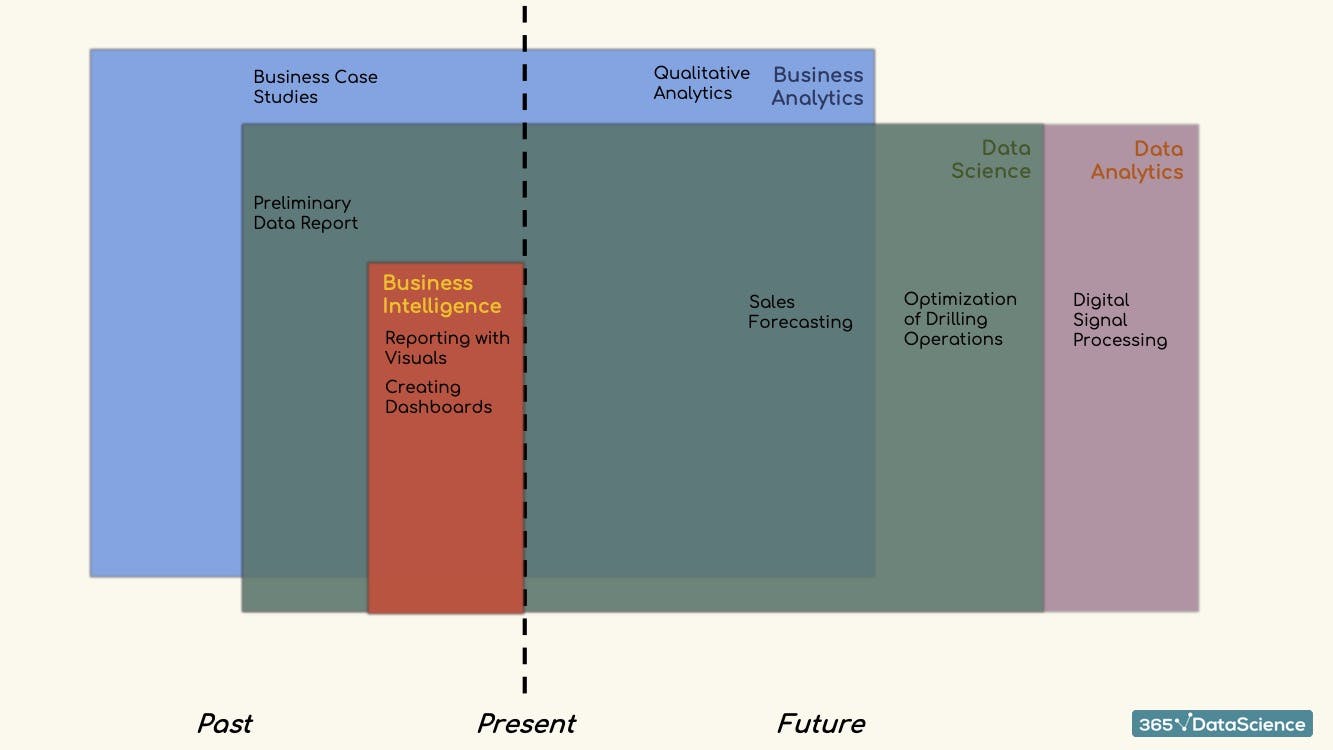
Business Intelligence (BI) is the process of analyzing and reporting historical data. Therefore, the business intelligence block must go on the left side of the dotted line and it must overlap with the data science block as a subfield. It sits within data science as it is a preliminary step of predictive analytics. Therefore, reporting data with visuals and creating dashboards can be moved to the business intelligence block. After reports and dashboards have been prepared by business intelligence analysts, advanced statistical methods like regression, clustering, factor analysis, logistic regression, and time series analysis can be applied to that data to accurately predict future outcomes.
Machine Learning and Artificial Intelligence
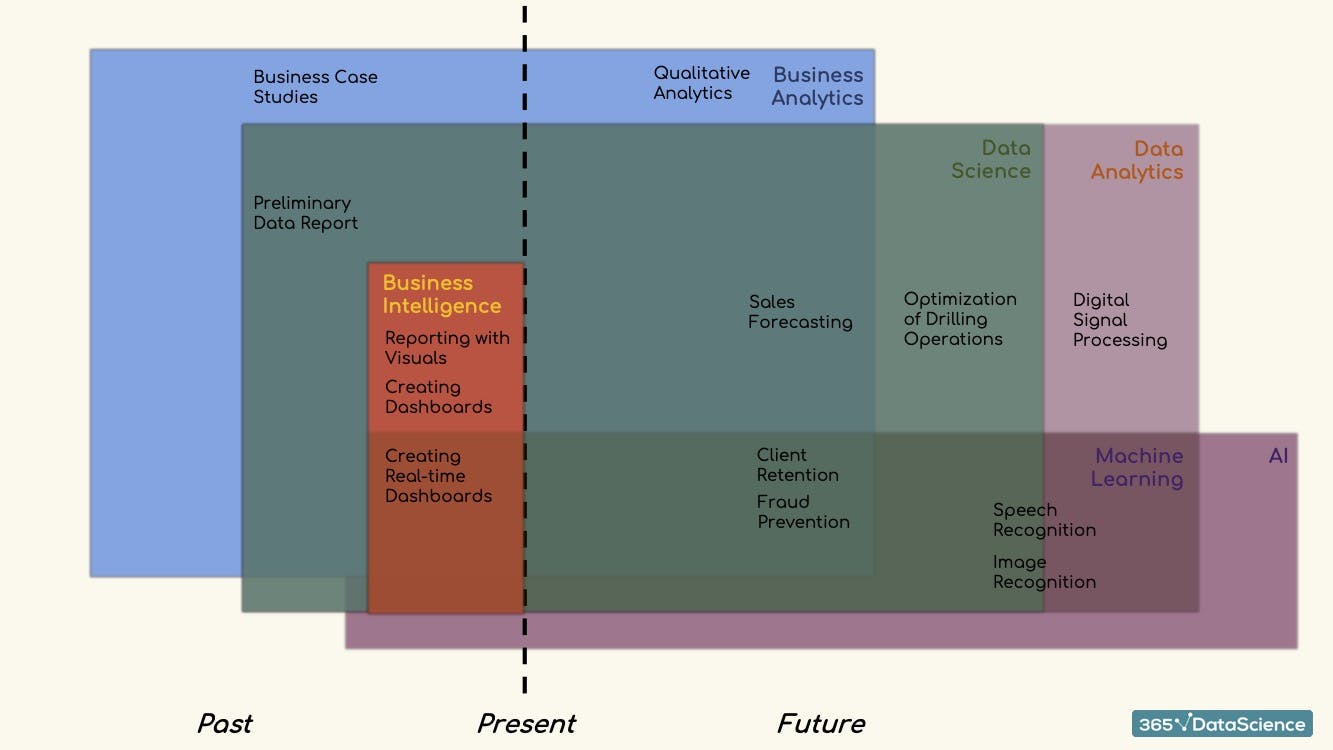
Machine learning is about creating and implementing algorithms that let machines receive data and use this data to make predictions, analyze patterns and give recommendations. Machine learning algorithms enable machines to predict outcomes without being explicitly programmed to do so. Since machine learning cannot be implemented without data, It should stay within the data analytics block. However, some people might argue that machine learning and data analytics are two completely unrelated scientific fields. But to keep things simple and stay on the topic, we will let machine learning overlap with data analytics as well as data science.
Machine Learning tools can help data scientists predict future outcomes in unprecedented ways. Some applications of machine learning within data science and business analytics fields include client retention and fraud prevention. We can feed machine learning algorithms with previous fraudulent data and it will find patterns that a human brain is simply incapable of seeing, thus can help us prevent future fraudulent activities.
The diagram shows that the machine learning block also overlaps with business intelligence. It is because of the increasing proclivity of using machine learning tools in the context of business intelligence e.g creating real-item dashboards. Machine learning tools can extract big data from sources like Facebook and Shopify to detect patterns and give recommendations and insights to managers.
There are other applications of machine learning that might and might not be of interest to a data scientist such as speech and image recognition. But for the sake of argument, let us put it in between both machine learning and data science blocks.
What about Artificial Intelligence (A.I)?
Artificial Intelligence, in simple words, is about enabling digital computers to perform tasks commonly associated with intelligent beings. It is about simulating human knowledge and decision-making with computers. So far, scientists have only managed to achieve AI through machine learning algorithms. However, the diagram shows that it goes beyond the machine learning block because there are some aspects of AI that are not considered machine learning. An example could include symbolic reasoning. It is based on high-level human-readable representations of logic and problems. It was once a trend in the past when people were trying to create human-like intelligence. However, today machine learning is the only form of AI that is being used and symbolic AI is rarely encountered. Therefore, let us keep it out of the equation.
Finally, we can group all these terms inside one umbrella term, Advanced Analytics. It is just a marketing term to tell people that the type of analytics you do is not simple and easy.
Alright, I hope that so far you have developed a good understanding of all these complicated buzzwords surrounding data science. It is important to note that the above representations might not be commonly-accepted meanings and representations. However, it is a comprehensive depiction of what these principles are and can help you narrow down your decisions when taking the first step of entering into a data analytics career.
Source: https://365careers.com